
This month we have Jorge Segarra (B|T) hosting the T-SQL Tuesday with the topic of Power BI.
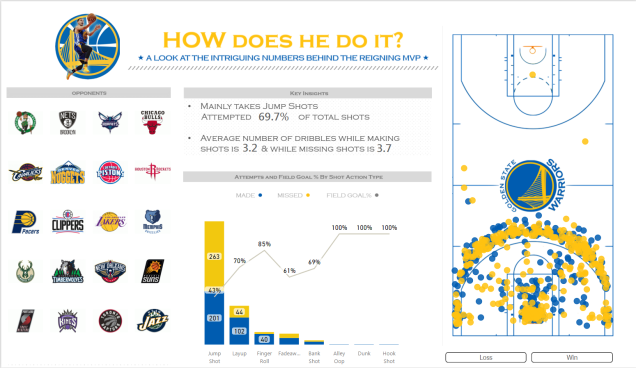
Hey data pros, people don’t want to look at your data in tables or result panes. They want charts, graphs and pretty pictures, right? To do that you need Power BI. Just look at this amazing stuff you can do with it. Seriously, go over to Jason Thomas’ site and check it out.
Now the danger of any BI is that data is distilled and as anyone with a pot still can tell you it doesn’t always come out so great and even when it does come out great, it might not be the best stuff for you. An older friend of mine once told me a story about his military service in WWII. Out of boredom they graphed and acyronymized their soda pop consumption. One day, their superior was giving a tour of their office and showed off said chart and everyone nodded in appreciation and utter ignorance. This could easily happen in any business with creative/bored developer and just a bit of time. For example here, I took a bunch of meaningless data, loaded it into Power BI and spit out some charts that would make an exec swoon.
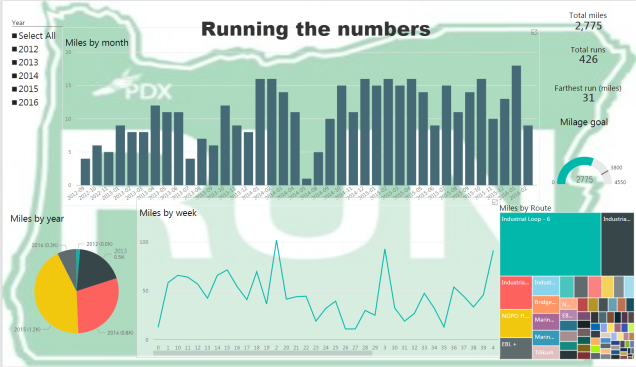
Here’s the pointy and clicky version, https://app.powerbi.com/view?r=eyJrIjoiMjJjYmY5N2ItMmRhYS00ZjRmLTk1MjMtZWRiMjEyMGJiMjk5IiwidCI6IjA4ZGU4NjI4LTU5M2UtNDNmNS05Y2ViLWYzZTVkZDdhZTJjYiIsImMiOjF9
Now I’m sure there are some very valid use cases for BI and implementations of Power BI. Just make sure you know what you’re sipping. Just because you can visualize data doesn’t always mean you should. The most important aspect of BI is that it solves a business question/problem, you know the B part of BI.

2 thoughts on “T-SQL Tuesday #75–Running with Power BI”